 RxLog Docs
Dashboard
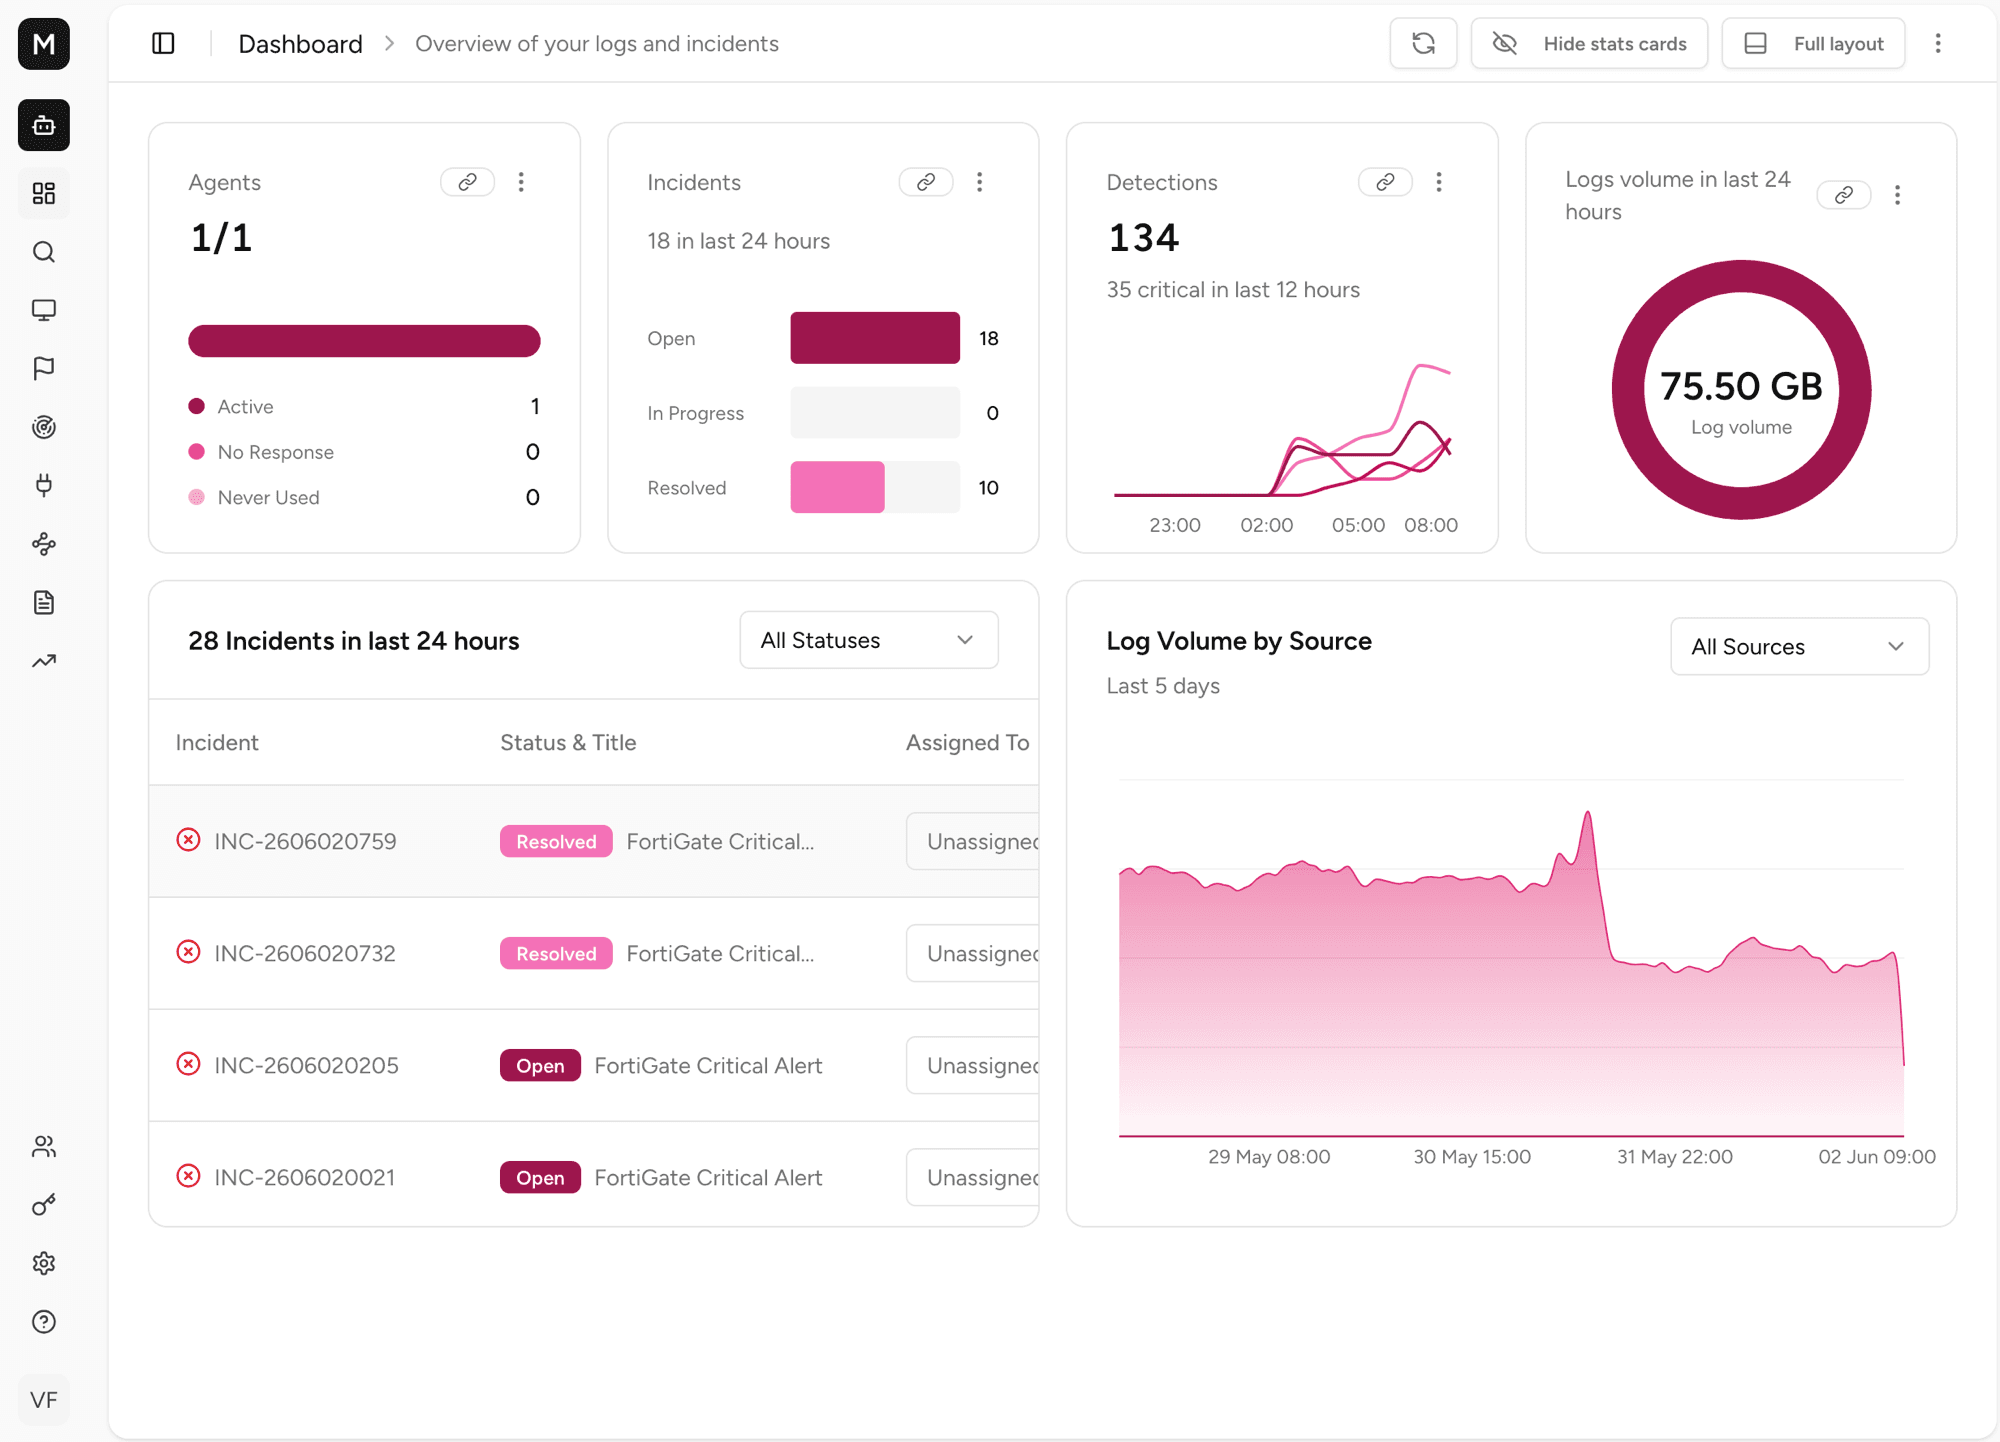
The Dashboard gives you a live overview of agents, incidents, detections, and log volume in one place.
The Dashboard is the first screen you see when you log in. It pulls together the most important numbers from across the platform so you know the state of your environment without opening each section.
What you can monitor
The top row of cards gives you a fast health check:
- Agents. How many agents are active out of the total. You can also see how many never responded or were never used.
- Incidents. Open, in progress, and resolved counts for the last 24 hours.
- Detections. How many detections fired, with a trend line over time.
- Logs volume. Total data ingested in the last 24 hours.
Below the cards you get two more views:
- Incidents in last 24 hours. A live list of recent cases with their status and assignee. Filter it by status.
- Log Volume by Source. A chart of how much data each source sends over time. Use it to spot drops or spikes in ingest.
How to use it
Open Dashboard from the left menu.
Scan the top cards for anything out of the ordinary.
Use the All Statuses filter to focus the incident list.
Check Log Volume by Source to confirm your sources are still sending data.
Use Hide stats cards or Full layout in the top right to change how much detail the Dashboard shows.