 RxLog Docs
Onboarding
Go from zero to your first query and detection.
This guide gets you up and running, then walks you through the platform one feature at a time. Each part has a short note on what it does and a few steps to get going. For a deeper look at any feature, open its page in the Platform section.
Get started in three steps
Create an account. Sign up and create a workspace. Each workspace is an isolated environment with its own sources, detections, and members.
Connect a source. Point a log source at RxLog. Start with any supported integration, a cloud provider, or an agent running on your own host.
Run your first query. Open Search and run:
SELECT * FROM logs ORDER BY timestamp DESC LIMIT 100You should see your most recent events stream in.
No data yet? Ingestion can take a minute or two on first connect. Check the source's status if nothing appears after that.
Dashboard
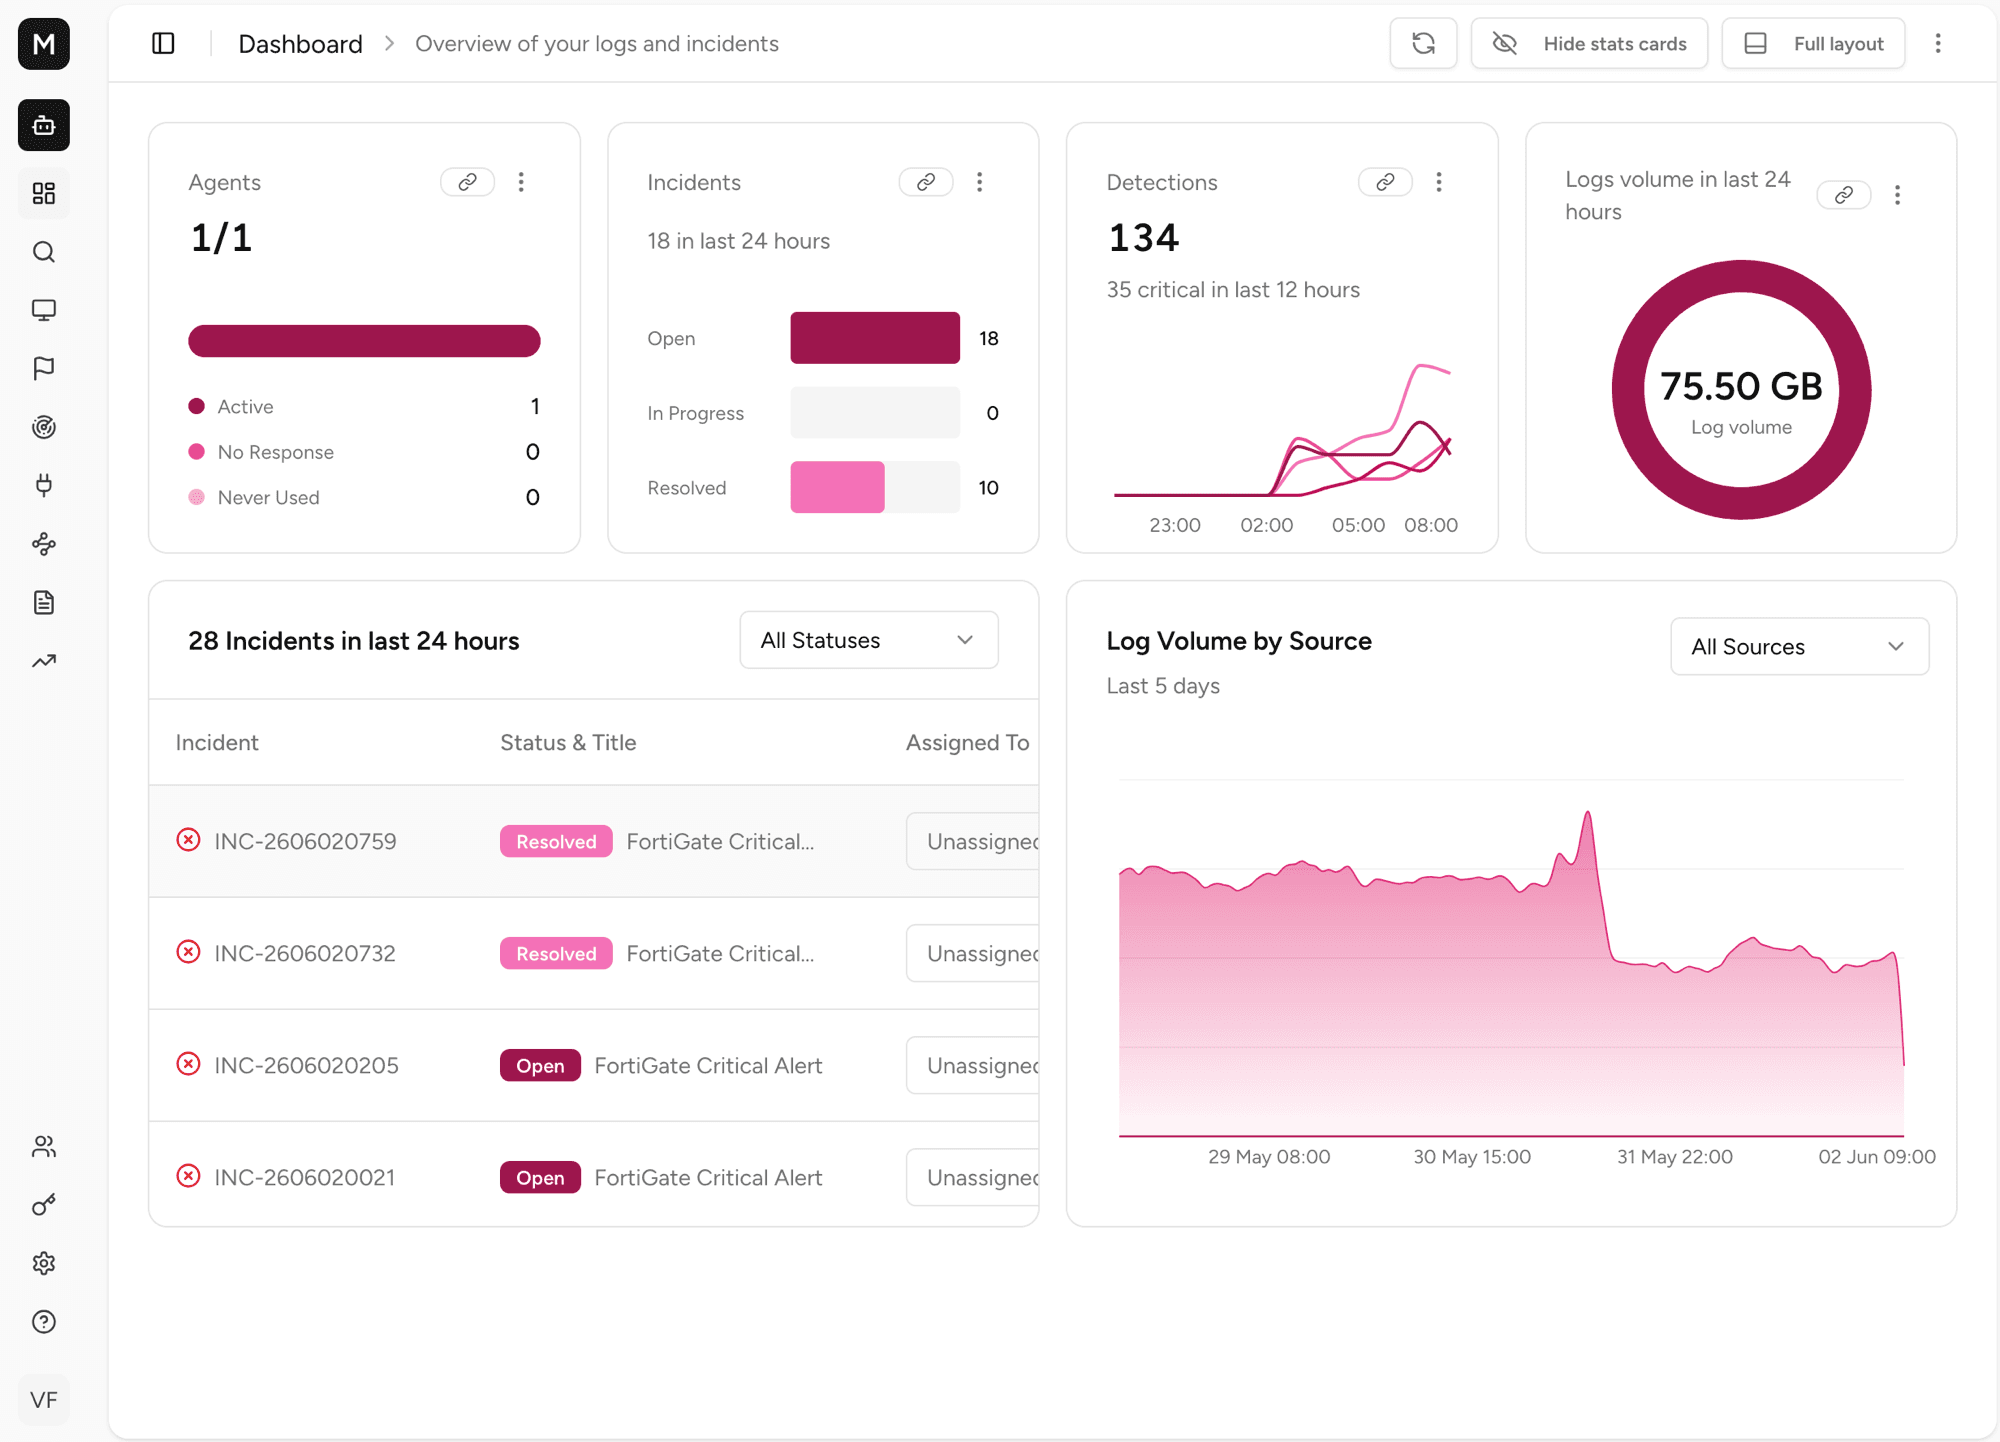
The Dashboard is your home screen. It shows the health of your environment at a glance: active agents, open incidents, recent detections, and log volume.
Agents
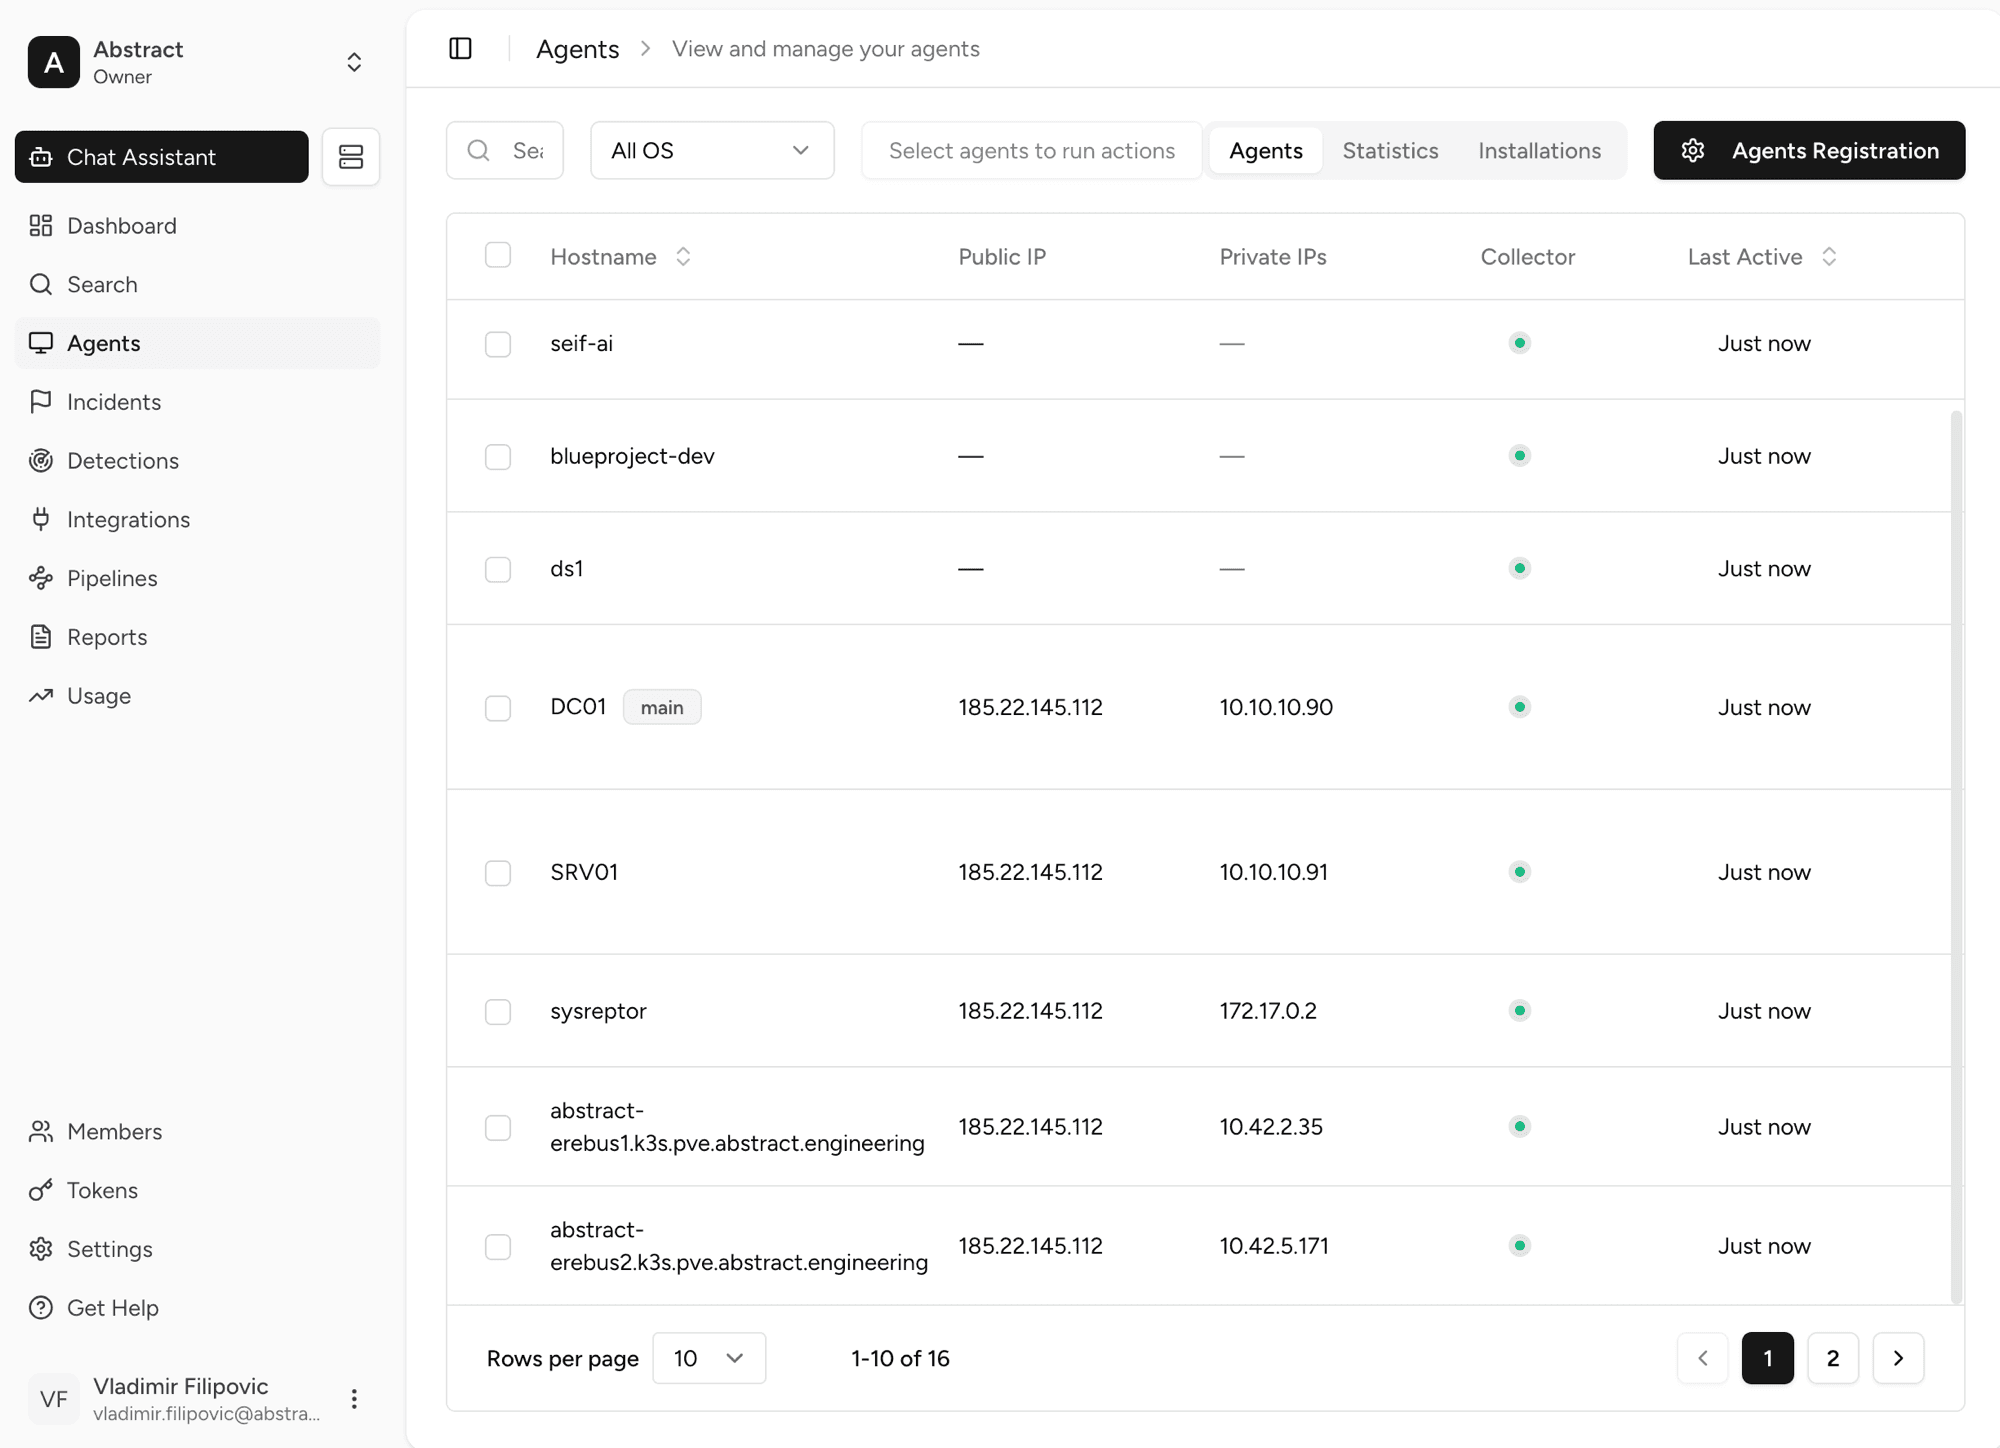
Agents are small collectors that run on your machines. They ship system events, audit logs, and files back to RxLog.
Integrations
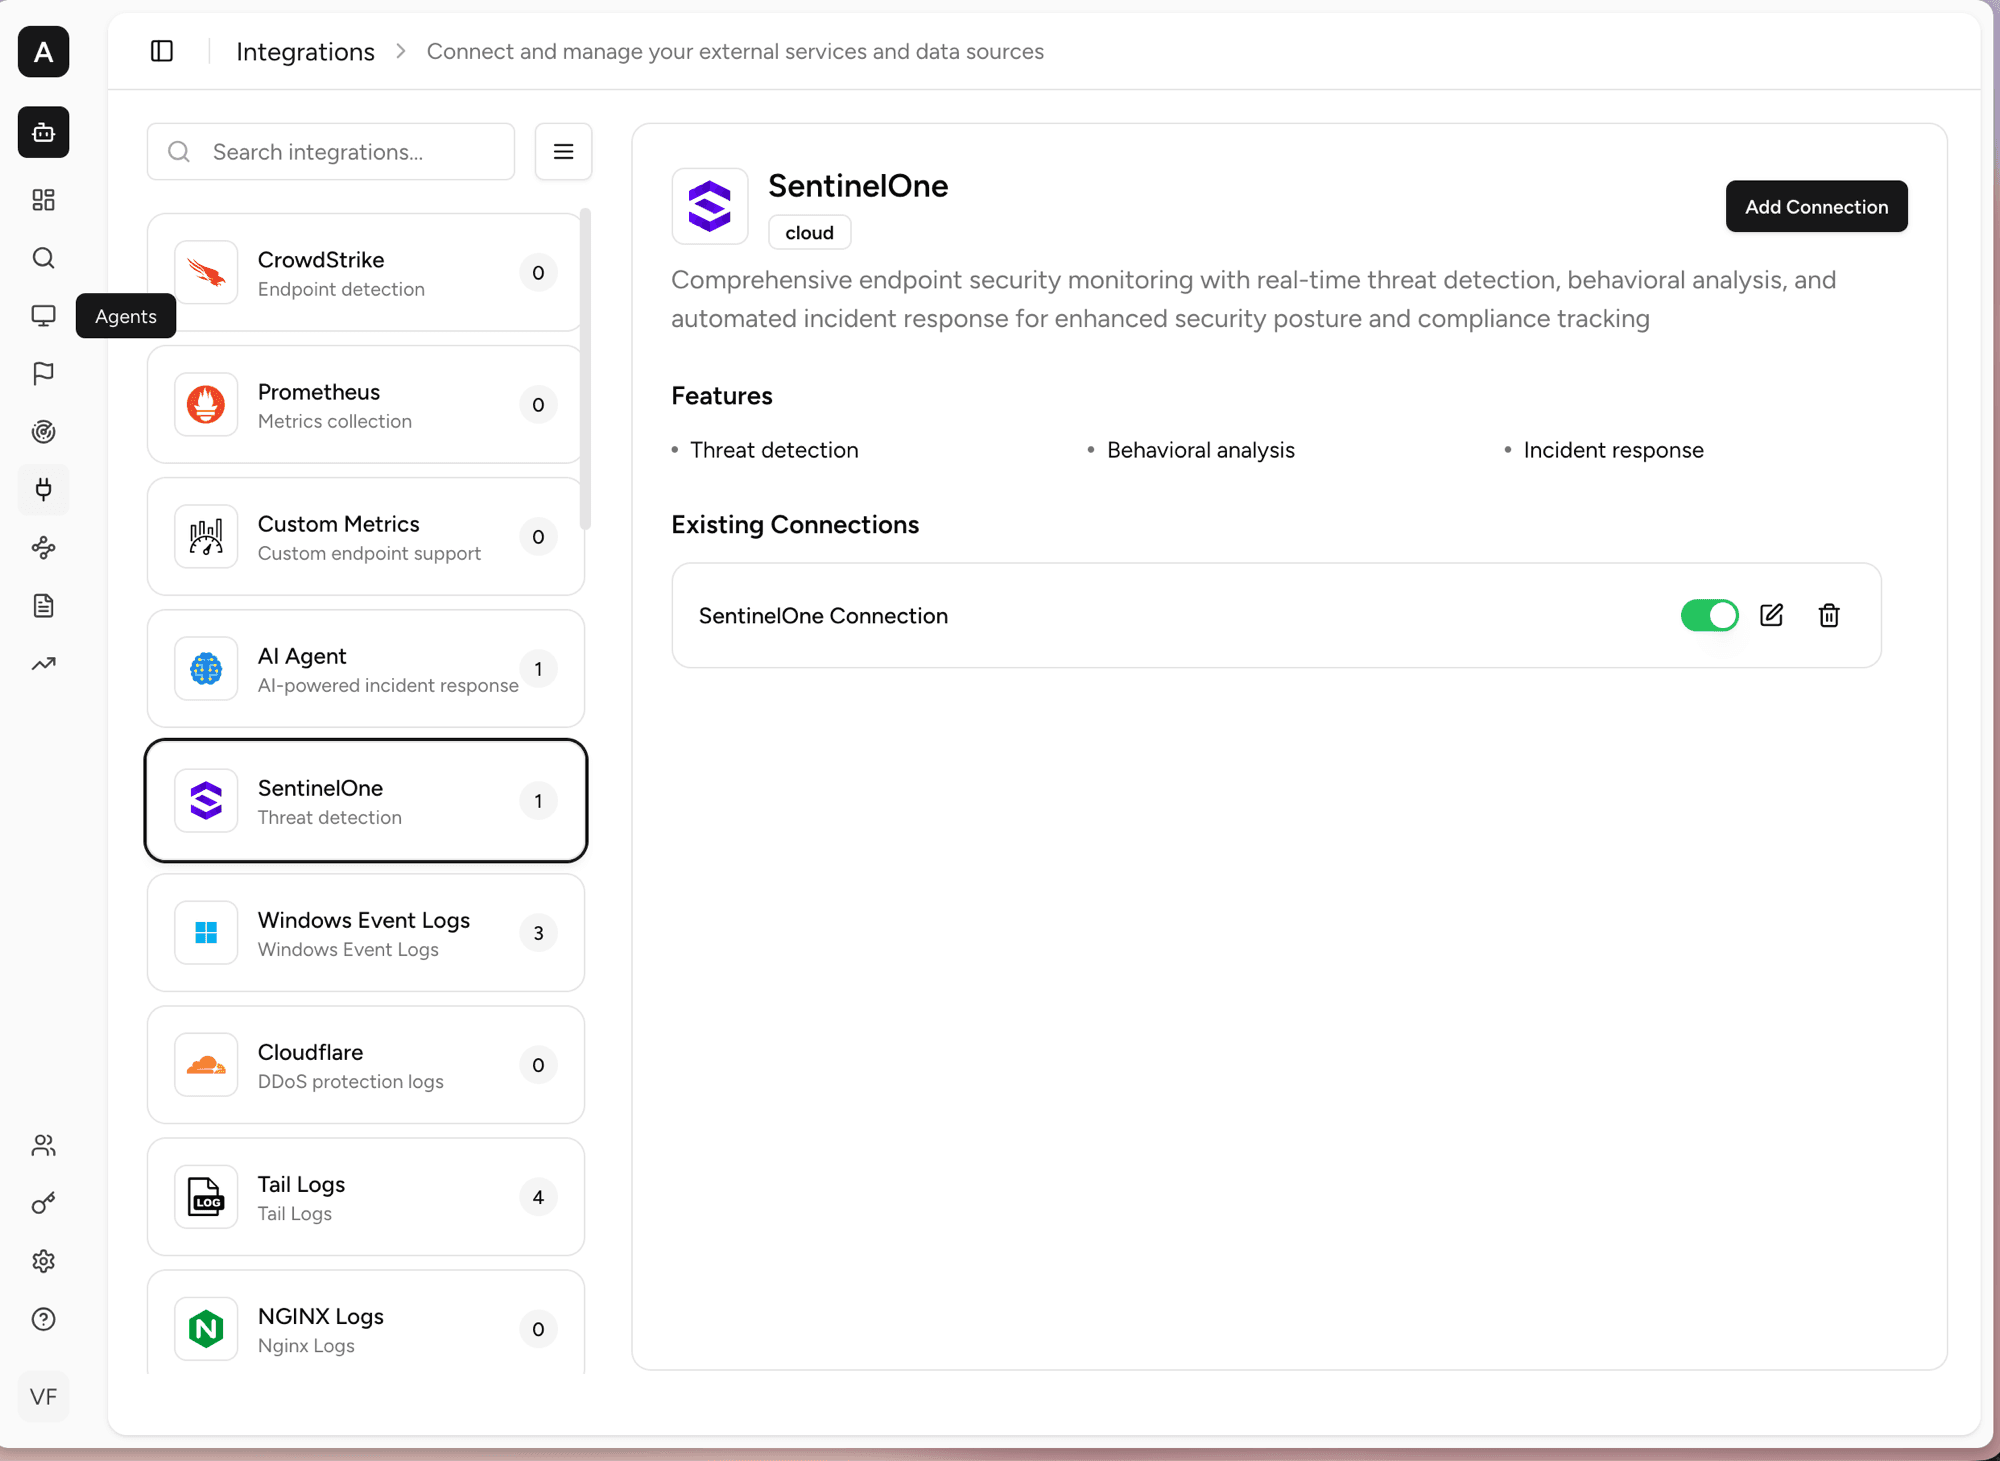
Integrations connect outside tools and data sources to RxLog. Examples are SentinelOne, CrowdStrike, Cloudflare, and Windows Event Logs.
Search logs
Search lets you query your logs with SQL. You can filter by source, inspect a single event, and ask the AI assistant about your results.
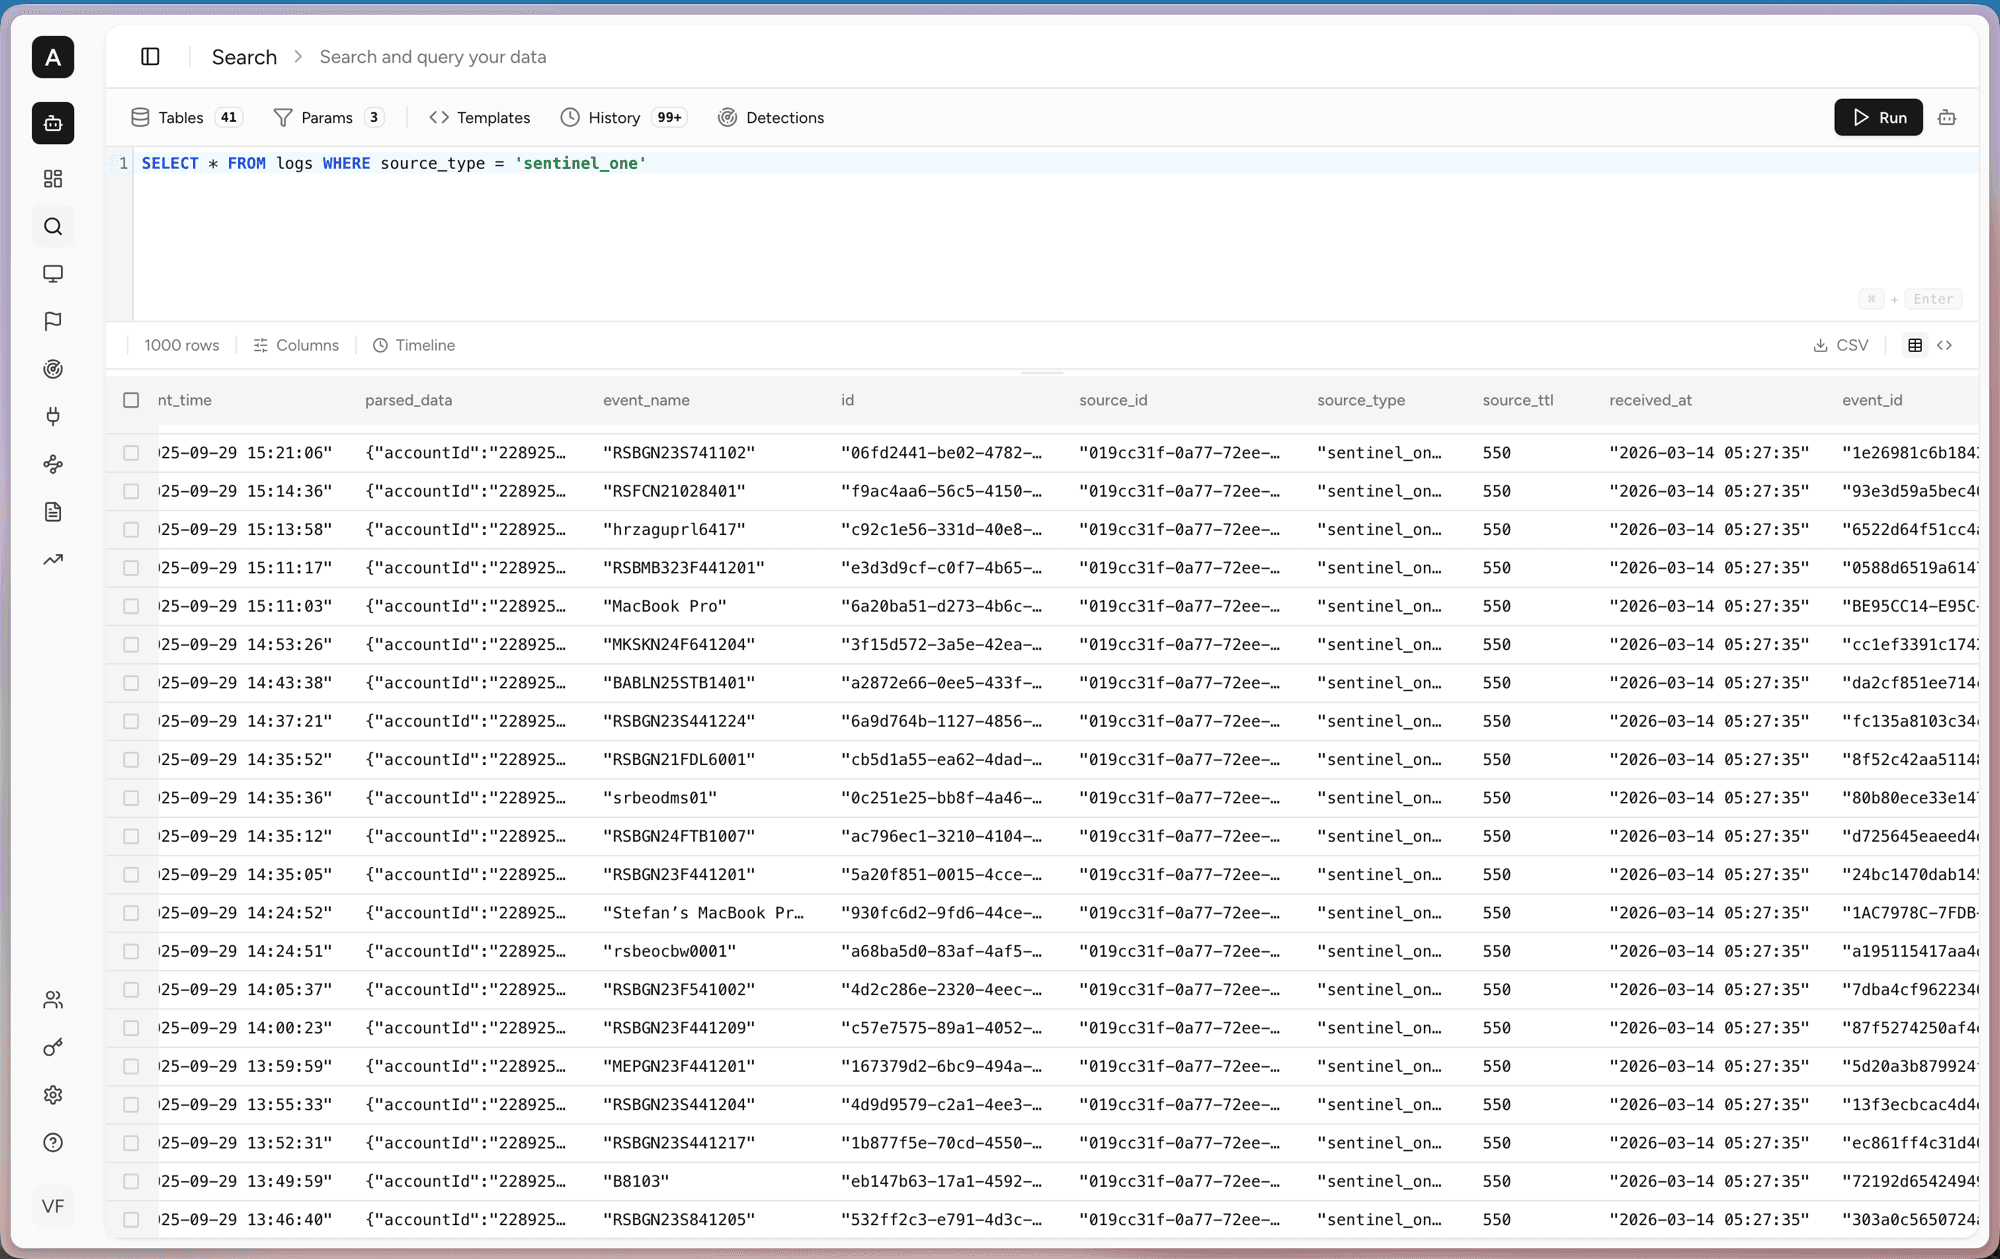
SELECT * FROM logs WHERE source_type = 'sentinel_one'.Detections
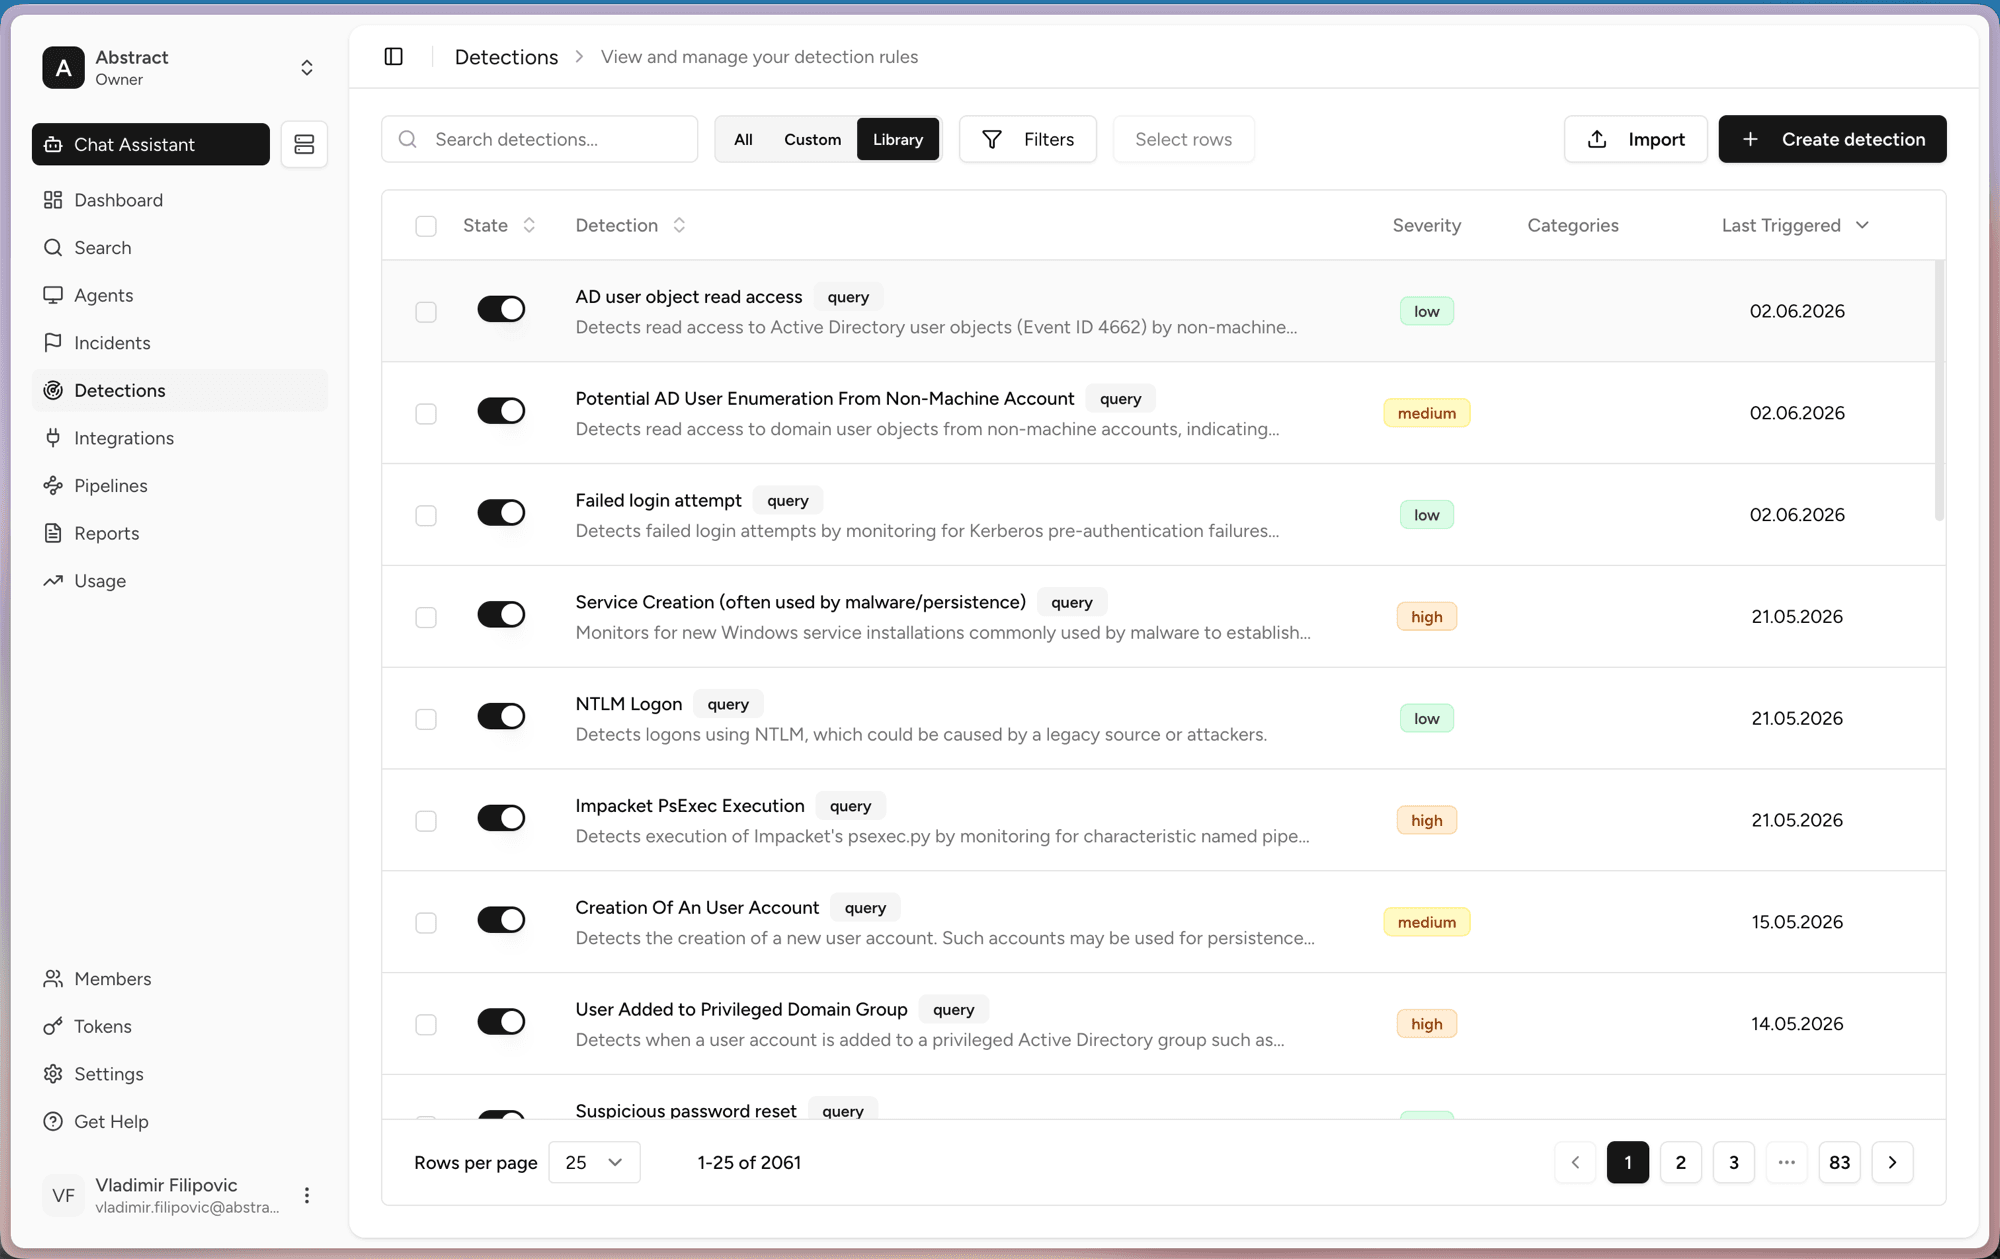
Detections are rules that watch your logs and raise an alert when something looks wrong. RxLog ships a large library you can turn on with one click.
Incidents
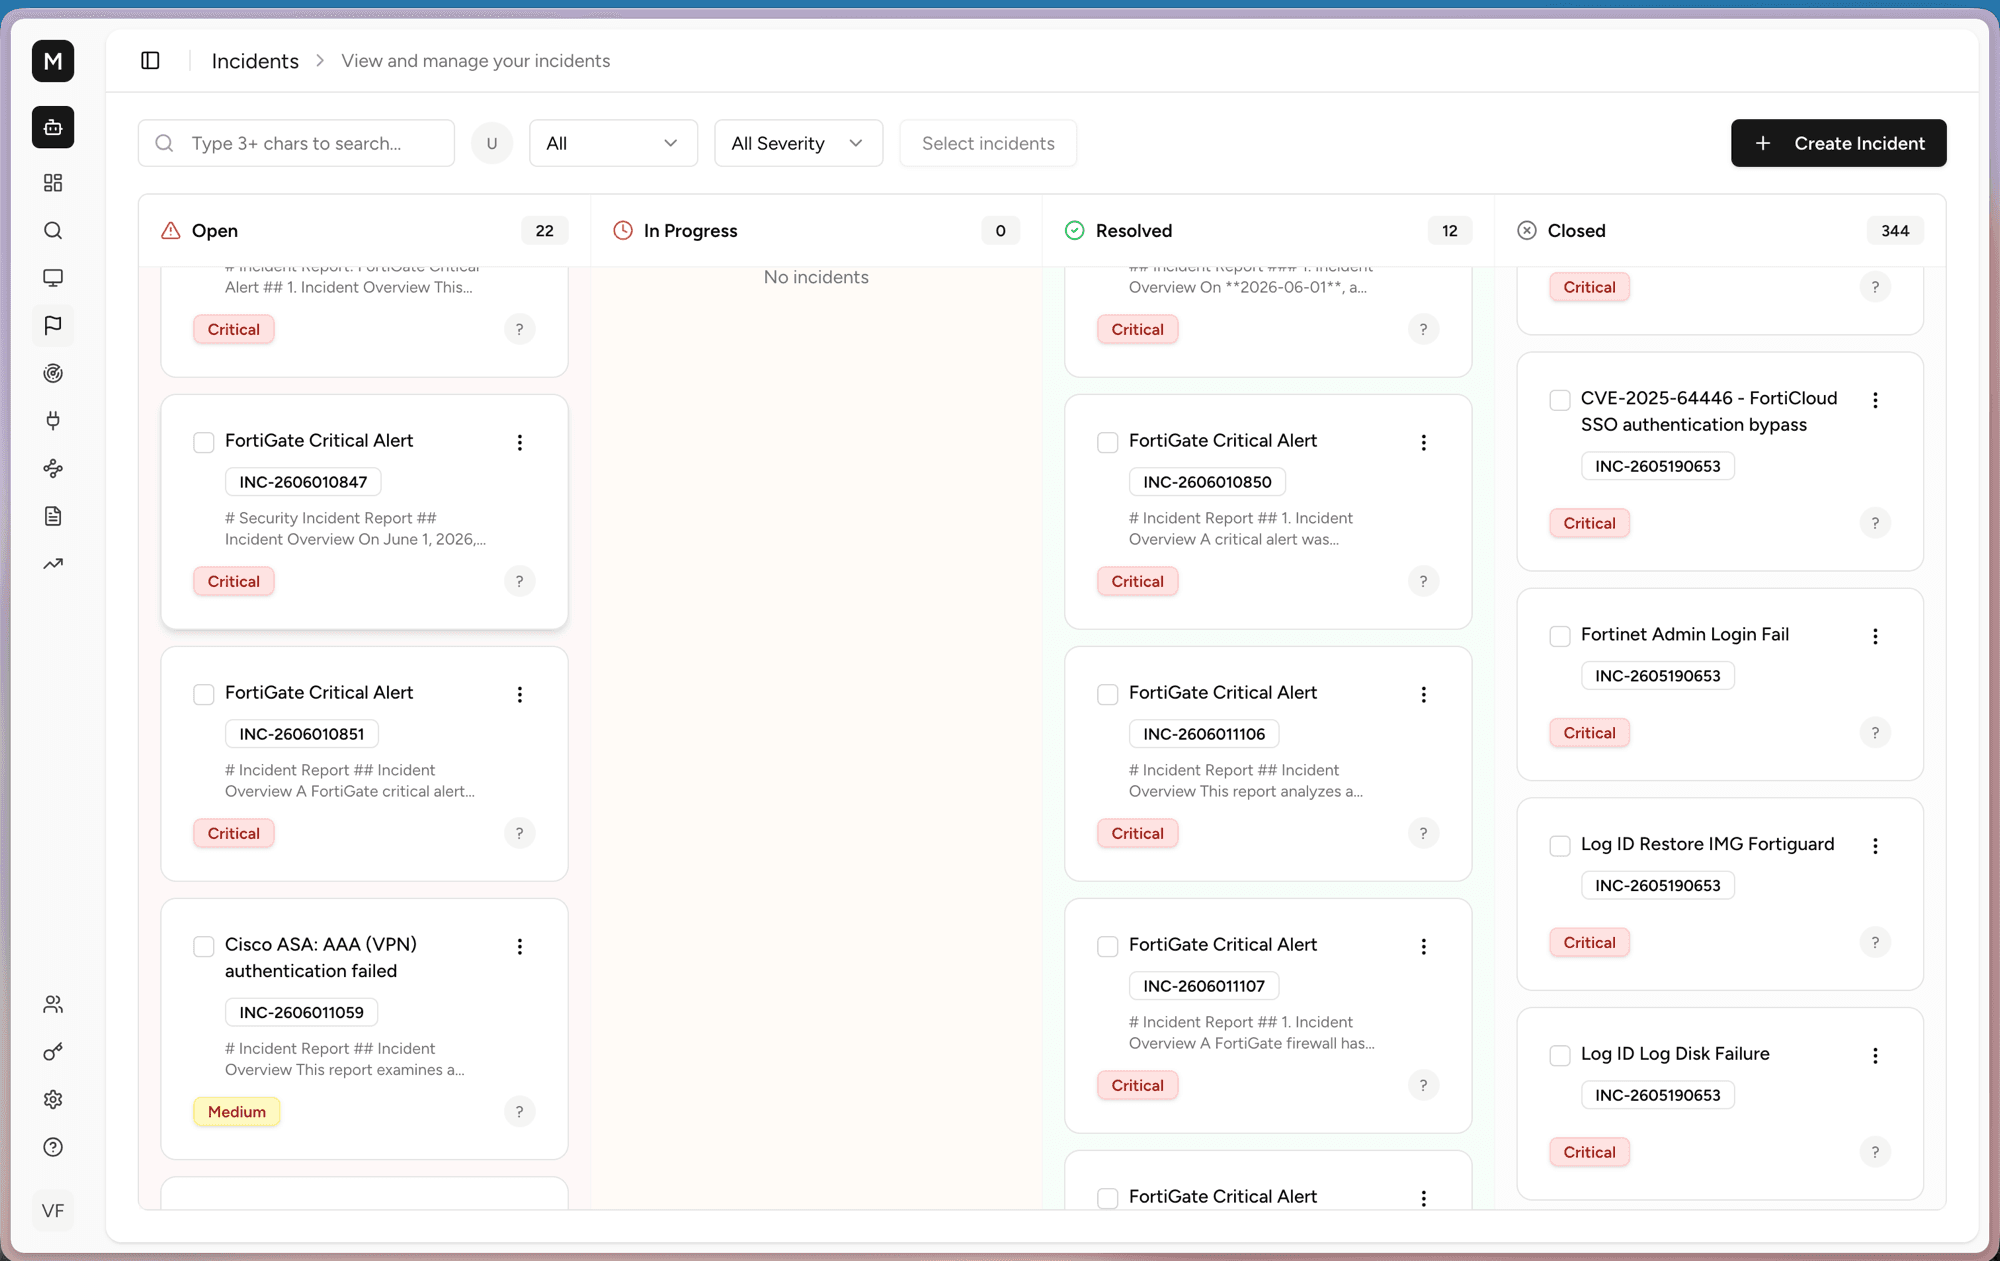
Incidents group related detections into one case. This is where you triage, investigate, and resolve threats.
Active Response Pipelines
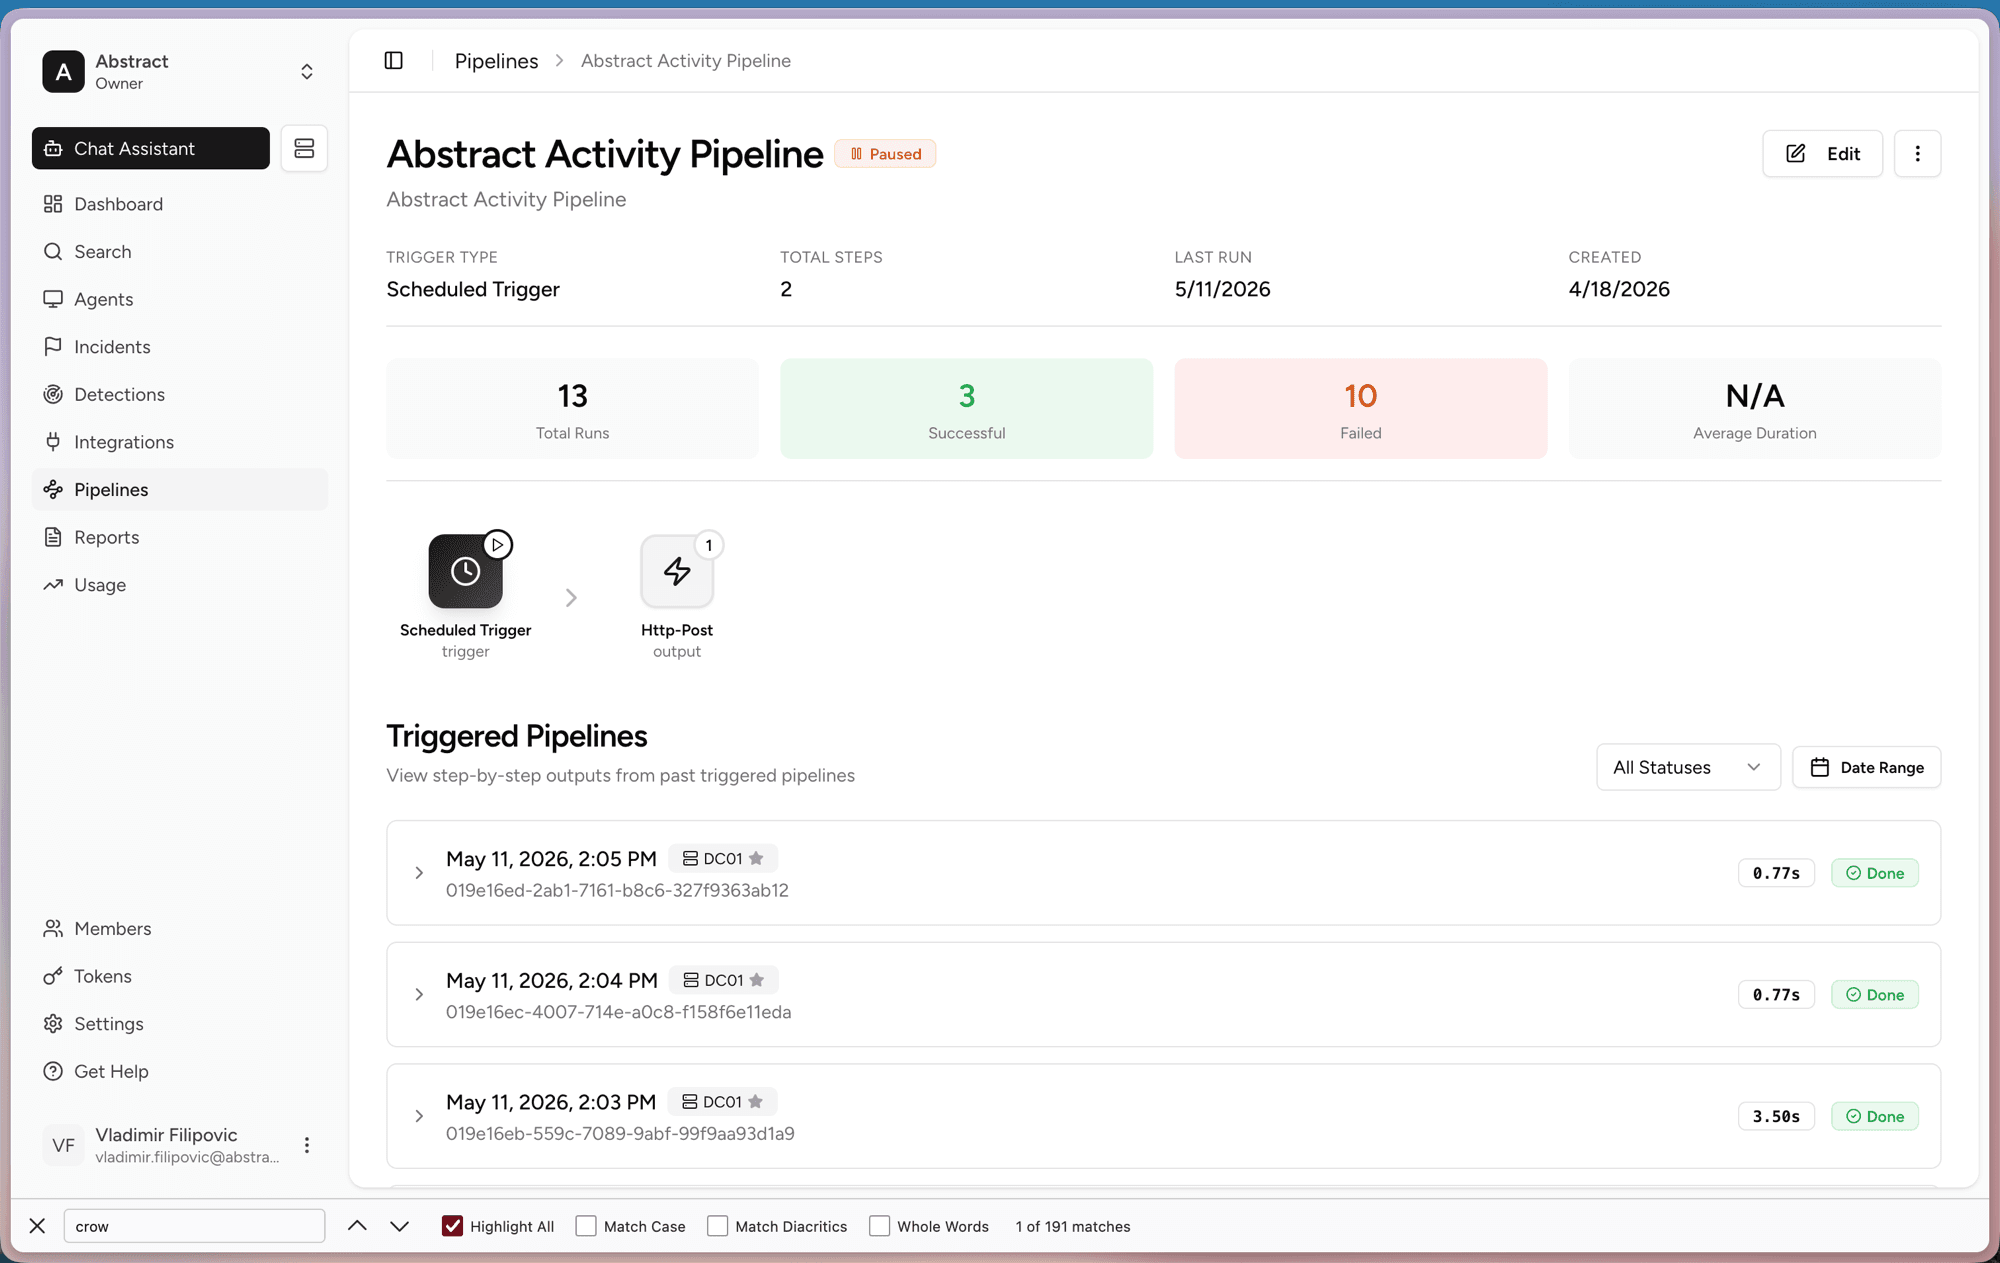
Active Response Pipelines react to detections and incidents automatically. When a detection fires, the pipeline runs its steps on its own — create an incident, send an alert, enrich the event, or push data to another system.
Introduction
RxLog collects logs and enables you to search them, investigate with AI, and detect and respond to threats in real time. These docs cover everything from first ingest to building automated response to threats.
Dashboard
The Dashboard gives you a live overview of agents, incidents, detections, and log volume in one place.